.webp)

Your careers site is much more than just a branding asset or another content page on your site. It’s a performance channel, and is often the first real touchpoint candidates have with your company. That first impression directly influences applicants’ decision about whether or not to apply, which can have a significant influence on the overall success of your recruitment efforts.
As hiring becomes more digital and competitive, that first impression needs to work harder. In fact, 33% of job seekers use employer careers sites as part of their job search.
To keep pace, leading TA teams are now treating their careers site like a marketing funnel. They track performance metrics, optimize conversion rates, and use data to hire smarter. In this article, we’ll break down the ten most important careers site KPIs to monitor, what they tell you, and how to use tools like Tellent Recruitee to keep improving.
Why you need to be tracking career site performance
Career site metrics are some of the most critical recruitment metrics you can track. They show how well your careers page performs and where it needs work. But their value goes far beyond UX.
With the right data, you can also uncover:
- How effective your hiring campaigns really are
- Where job seekers drop off in their journey
- Which channels and job boards drive real results
This insight helps you double down on what works, cut spend where it doesn’t, and fine-tune your strategy from first click to final hire.
Ultimately, tracking these metrics allows you to:
- Spot friction in the candidate journey before the apply button
- Make smarter, data-led recruitment decisions
- Improve time-to-hire and recruitment ROI
- Measure and strengthen your employer brand
Career site performance tracking goes well beyond just optimizing one page or sub-directory. It’s about making every step of the hiring process more efficient by understanding what’s working well, what needs improvement, and where new opportunities lie.
‘Your employer brand is more than a showcase—it’s a reflection of your culture and values. A career site with authentic employee stories, immersive behind-the-scenes content, and clear job insights builds trust, engages candidates, and increases conversions. Unlike social media, your site is a lasting resource that helps candidates envision their future with your company.” — Charlène Hemery, Founder of TalentCatcher and former recruiter
How to set goals and KPIs for your careers site
Before you dive into the data, zoom out. What do you actually want your careers site to achieve?
For some teams, it’s about volume—getting more qualified applicants in the funnel. For others, it’s about experience—reducing drop-offs and giving candidates a better first impression. Your goals will determine which metrics matter most.

Ask yourself:
- Are we trying to increase the total applicant volume?
- Do we need to improve the quality of candidates applying?
- Is our priority to enhance candidate experience and brand perception?
Each of these requires a different focus. Application starts and source of traffic tells you about reach. Conversion rate and bounce rate speak to quality and intent. Time on page and return visitors reflect engagement and employer brand strength.
Keep this stage focused. Pick three to five core KPIs tied directly to your recruiting goals or OKRs. That way, you’re tracking what actually moves the needle, not just what’s easy to measure.
If you’re unsure what to track, don’t worry. Here’s a list to get you started.
Which careers site metrics should you track?
Modern analytics tools can track just about everything. But if you try to follow it all, you’ll quickly drown in data with no clear direction. Instead, as covered above, focus on the metrics most closely tied to your business goals or team OKRs.
The list below includes ten of the most common and useful careers site performance metrics. It’s a starting point—meant to spark ideas and help you prioritise. Not every metric will matter equally to every team.
With that in mind, let’s look at the numbers worth watching.
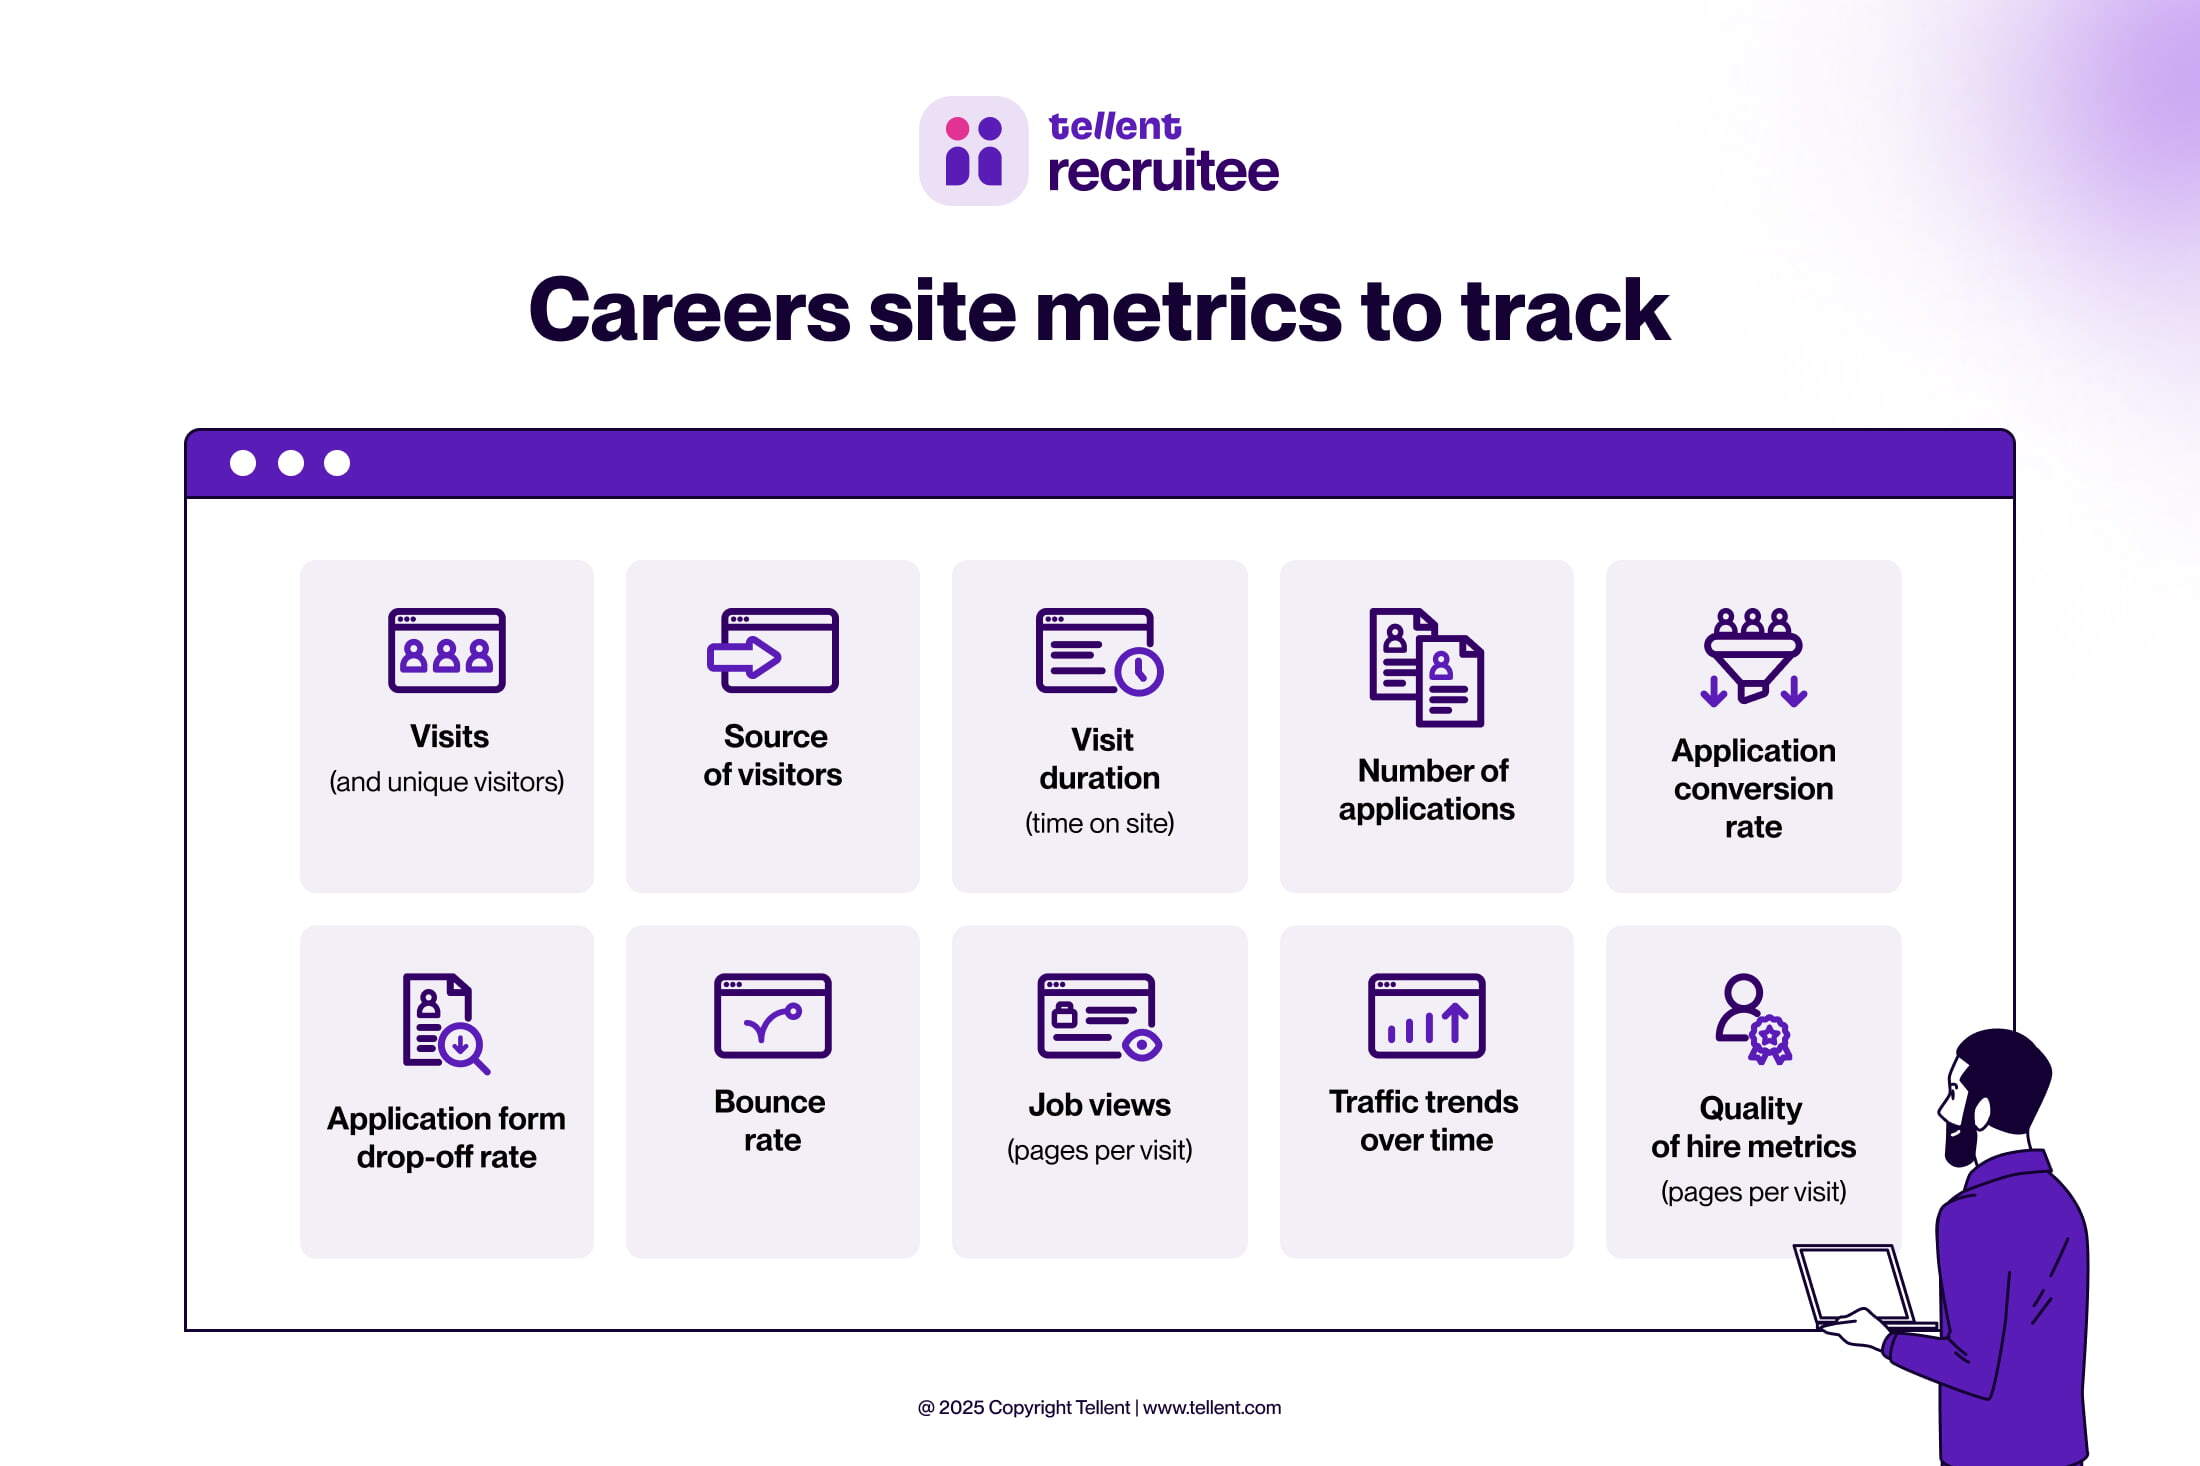
1. Visits (and unique visitors)
Visits track the total number of sessions on your careers site. Every time someone lands on it, regardless of whether they’ve been there before.
Unique visitors, on the other hand, tell you how many individuals are showing up. Both numbers matter.
Visits are your top-of-funnel metric. You can’t get applications from people who don’t land on your page. Steady growth here suggests your employer branding, job distribution, and SEO efforts are paying off.
Zoom out to view traffic trends week-by-week or month-by-month. Spikes might align with a new campaign. Dips could mean job posts need a refresh. But, when monitoring these trends, don’t just focus on volume. Track returning visitors too. A high number of repeat visitors could indicate strong employer brand pull or candidates doing deeper research before applying.
2. Source of visitors
Not all traffic is equal. General traffic from the open web is likely to have higher visitor volumes but lower engagement. Traffic from highly niche and relevant websites or communities, however, might be lower volume but much more qualified and engaged.
The source of visitors metric tells you where your candidates are coming from—whether that’s organic search, job boards, social media, or employee referrals.
This matters for two reasons:
- First, it shows which channels are doing the heavy lifting in attracting talent.
- Second, it helps you calculate ROI. If one job board brings traffic that never converts, it may not be worth the budget.
Layering together visitor volume, engagement, and source of visitors allows you to understand which type of traffic ultimately performs best, allowing you to focus your attention on the most effective channels—even if visitor volumes are lower.
Use this insight to double down on what’s working and drop the rest. A campaign that sends five high-quality applicants is better than one that sends 50 that bounce immediately.
3. Visit duration (time on site)
Visit duration is the average time someone spends on your careers site. It’s a strong proxy for engagement.
If candidates are sticking around, they’re likely reading your content, browsing open roles, or exploring what it’s like to work at your company.
Short visits (under 30 seconds) may indicate confusion or a mismatch between expectations and content. Longer visits—especially on job or culture pages—typically mean higher intent to apply.
Our ‘State of Hiring in 2025’ report found that higher time-on-site was directly correlated with better conversion. In France, for example, the highest application rate coincided with an average visit duration of 4.6 minutes—a clear signal that well-engaged candidates are more likely to hit apply.
“Candidates who spend more time engaging with employer content are more likely to complete an application and proceed further into the hiring process” — The State of Hiring in 2025
To boost this metric, enrich your pages with videos, employee quotes, and helpful FAQs. And if a page has unusually high dwell time but few conversions, check whether the content or next steps are clear.
4. Number of applications
Applications are the careers site’s ultimate conversion signal. This metric tracks how many candidates actually hit ‘apply, ’giving you a direct view into whether your site is doing its #1 job.
If you’re seeing lots of visits but very few applications, something’s off. It could be the way jobs are framed, the clarity of next steps, or even a poor mobile experience. Either way, this is a strong signal that you need to look into further.
That’s why careers site performance it’s not just about traffic volume—it’s about context. Pair this metric with traffic source data to understand which channels are bringing in applicants who convert.
Fifty high-quality applications from employee referrals may be far more valuable than 200 from a generic job board.
Calculating application rates by traffic source is one way to start uncovering this context and optimizing your recruitment strategy.
You can also track application volume over time to evaluate campaign success or seasonality.
5. Application conversion rate
Application conversion rate is the percentage of visitors who submit an application. If 1,000 people land on your site and 50 apply, that’s a 5% conversion rate.
This is a core health check for your careers site. While traffic tells you who’s browsing, this tells you who’s compelled enough to take action.
‘The State of Hiring in 2025’ report found that top-performing sites saw conversion rates as high as 10%, while the average hovered in the low single digits. Benchmarking yours will help you understand where you’re starting from, and how you progress over time.
A low rate may point to friction in the application flow, unclear job descriptions, or weak alignment between what candidates see and what they expect.
Use this number to assess your site’s performance at a glance, and test changes to boost it over time.
Tip: Tellent Recruitee’s analytics dashboard shows conversion rates per job or source, making it easy to act on this insight.
“A seamless candidate experience improves conversions. Career sites that are easy to navigate, mobile friendly, and provide clear information on the recruitment process see lower application drop off rates. Simple, intuitive application forms increase completed applications.” — The State of Hiring in 2025
6. Application form drop-off rate
Application form drop-off rate tells you how many people start—but don’t finish—your job application.
If 100 people begin the form but only 60 complete it, that’s a 40% drop-off. In any context, a number like that is a massive loss of engaged candidates. You need to know what yours is so that you can improve it.
Why do people abandon mid-application? Our hiring report found that “lengthy or confusing processes lead to higher drop-off.”
Common culprits include long forms, poor mobile UX, unclear steps, or technical issues.
Even small fixes here—like reducing steps or clarifying instructions—can yield big gains in total applications without needing more traffic.
7. Bounce rate
Bounce rate measures how quickly visitors leave a career site after landing on it. More specifically, it’s the ratio between bounced sessions—one that ends after the first page view— and all sessions. This ratio gives you a measurement of how many visitors landed on your site but didn’t click on any internal link or interact meaningfully with the page.
This metric highlights the disconnect between what candidates expect and what they actually find. If someone searches “remote design jobs” but lands on a generic jobs page with no relevant listings, they’re gone in seconds.
‘The State of Hiring in 2025’ report found that bounce rates in some industries reached up to 70%, directly correlating with longer time-to-hire.
To reduce bounce rates:
- Ensure job ads and SEO snippets match landing page content.
- Segment careers pages by team, location, or keyword.
- Speed up load times and optimize for mobile.
- Lead with compelling headlines and visuals that spark interest.
High bounce rates is only one indicator of engagement, but it’s a strong signal that your first impression isn’t landing. Track it by page to spot where attention slips and make sure every visitor finds what they came for.
8. Job views (pages per visit)
This metric tracks how many individual job posts or other careers pages a visitor views in a single session. It’s a key signal of engagement depth.
If candidates are viewing three or four roles per visit, that suggests strong employer interest and a user-friendly experience. But if most users view just one page before leaving, it could mean they didn’t find relevant openings, or didn’t feel compelled to explore further.
To increase views, surface similar or related roles (“People also viewed”), and make job categories, filters, and search functionality easy to navigate.
Pro Tip:
Pro Tip:
Tellent Recruitee makes this easy to monitor with “Most visited jobs” and “Visits per job” analytics. Use this insight to highlight roles with strong appeal, and replicate what’s working across your open positions.
9. Traffic trends over time
Single metrics tell you what’s happening now. But trend lines tell you what’s changing, and whether your efforts are paying off.
Tracking visits and applications over time reveals seasonal hiring patterns, the impact of campaigns, and overall momentum, allowing you to make informed and strategic decisions about what comes next.
For example, a Q1 spike in traffic after launching a new employer brand campaign is a positive sign. A long flatline might be a signal that your campaign fell flat.
Likewise, spikes and troughs in applicant conversions that correspond with specific times of year are a good indication of seasonality. Identifying these trends helps in a variety of ways. First, you can plan for dips in applicant activity during downtimes. And prioritize strategies to turbocharge inbound application volumes—and quality—during boom times.
Pro Tip:
Pro Tip:
Tellent Recruitee includes built-in trend dashboards so you can see weekly and monthly shifts in performance at a glance. Get in the habit of checking these regularly, and use the data to inform continuous site improvement.
10. Quality of hire metrics (advanced)
Traffic and applications matter. But in the end, hiring teams care about hiring quality, not just volume.
That’s why most companies go a step further and find ways to tie careers site traffic to hiring outcomes.
To do so, you might track:
- How many career site applicants advance to interviews
- Which candidate sources consistently yield successful hires
- Applicant-to-hire ratios per role or campaign
You’ll need an ATS that connects to your career site metrics to start connecting these dots. The ideal state will be able to track all priority metrics on either side of the application event—pre-application and post-application. This will allow you to understand traffic volumes, sources, and engagement, and how that corresponds to applications. Then, you’ll be able to understand how those applications mature into hires.
This gives you full end-to-end visibility into your career site’s performance and influence on hiring outcomes—the goal standard for recruitment process optimization.
Turning career site performance metrics into action
Your careers site isn’t just a static page that you can set and forget. It’s a living part of your hiring strategy. And like any good strategy, it needs data to evolve.
The metrics in this guide are your roadmap. They show what’s working, what’s not, and where there’s room to grow. As ;The State of Hiring in 2025’ shows, better engagement leads to faster, more effective hiring.
So here’s your move: log into your analytics dashboard, scan your careers site KPIs, and ask. What story is the data telling?
With the right tools and a clear view of performance, talent teams can stop guessing and start shaping hiring success—one click, view, and application at a time.