The future of work is not something you have to gaze into a crystal ball to see.
As employers gear up for 2021 and beyond, many are already building on the lessons they learned while in crisis mode.
To set themselves up for success in “new normal” mode, whether in a fully remote or hybrid set-up, flexibility is key. So is the ability to collaborate and connect the dots. It’s no wonder, then, that they require tools that are as flexible as they are.
Pandemic or no pandemic—HR and talent acquisition teams are more reliant than ever on recruitment analytics to measure and monitor their hiring performance. And not surprisingly, they don’t all use the same ingredients or follow the same recipe.
If this sounds like you and your team, that means you already know what metrics you have to track to support your goals and show how you’re doing against your history.
We built our report builder feature to give you the freedom to convert your data points into insights that make sense for you and your business. Here’s how you can create a custom recruitment dashboard—built with tailored reports—right inside of Recruitee’s reports page:
Create new dashboards
A recruitment dashboard pulls together reports on metrics such as candidate source and time to hire, so you can discover the state of your hiring in a snap.
Within your new reports space, you’ll find Essentials. These are dashboards built by us and keep track of essential metrics for you.
For example, the Disqualifications dashboard gives you a bird’s-eye view of disqualifications in your hiring pipelines or talent pools, such as how long it takes to disqualify candidates or which disqualify reasons are used most frequently.
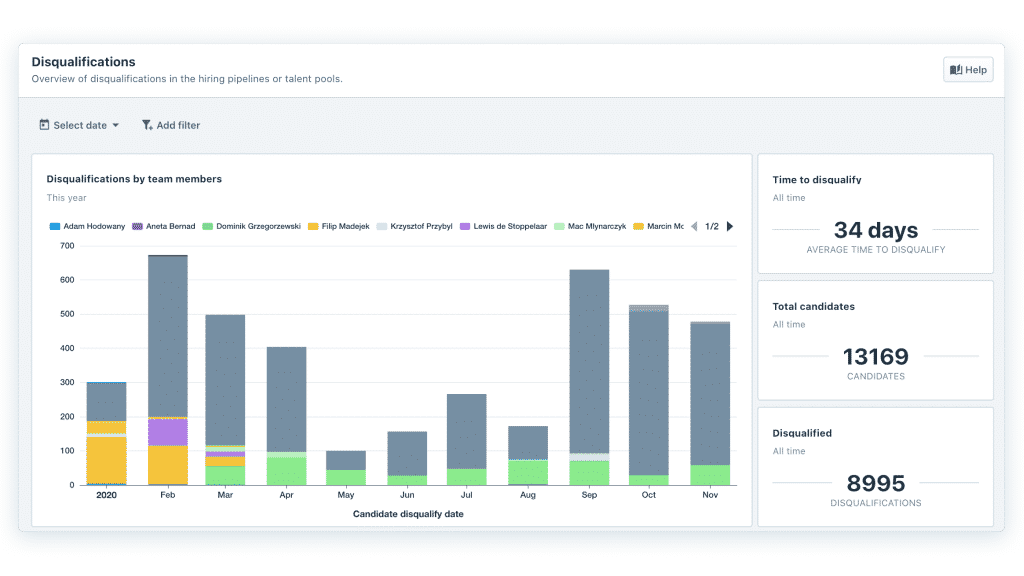
You can also monitor your interview events and compare evaluation ratings, or get a quick overview of active jobs per department.
Select “New dashboard” to create a recruitment dashboard you can fill with your own reports.
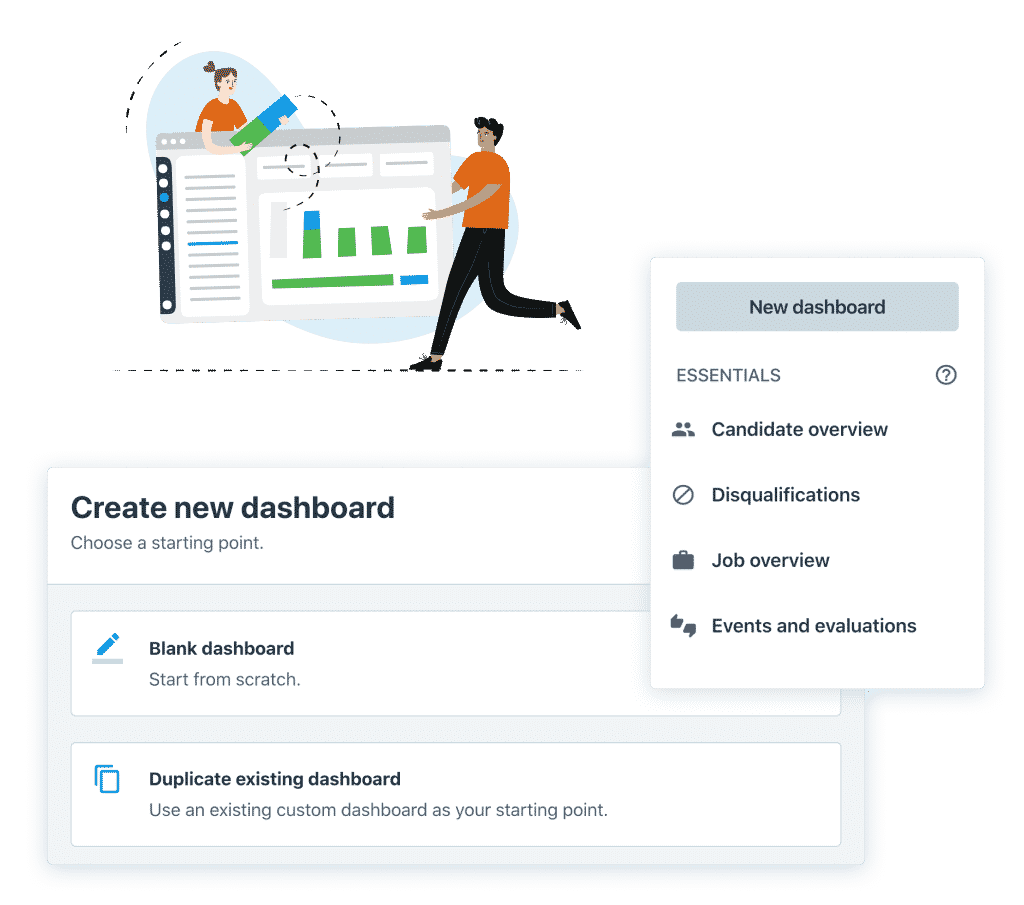
You can create as many new dashboards as you want and duplicate or delete existing ones. Your dashboard can be private (visible to only you), or you can allow selected hiring roles or all team members to view it.
After you’ve created a dashboard and given it a name, you can add reports. You have access to a library of pre-made reports you can work with right out of the box. Or you can start from scratch and build your own.
Add your reports
With your reports set up in one place, you can dig into your recruitment data to see what you do well, pinpoint areas that need work, and make more accurate decisions.

In the report library, you can explore reports based on common questions, such as “What is the total number of applications per job?” and “Where have your candidates been coming from?”
To find a report, you can browse categories like jobs, candidates, and hires, type what you’re looking for in Search or filter by visualization or report type. “Add report” to get started.
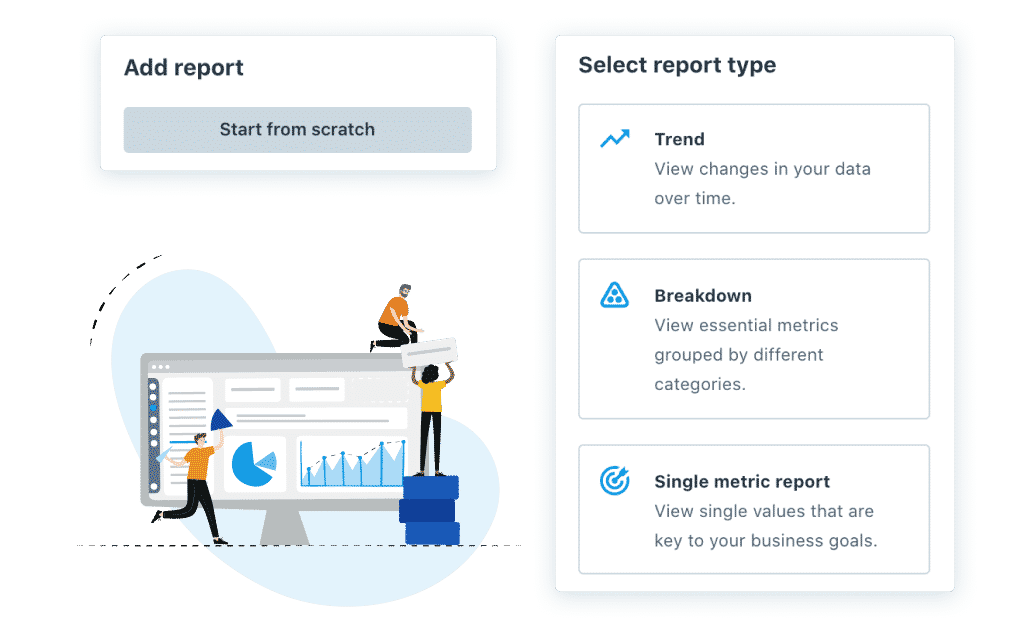
If you’re not using the report library but starting from scratch, your first step will be to select the type of report you want to create:
Trend reports
With Trend reports, you can view changes in your data over a month, a week, etc. It’s a useful report for when you want to see, for example, how many candidates your team disqualified over time or how many hires you made in each job.
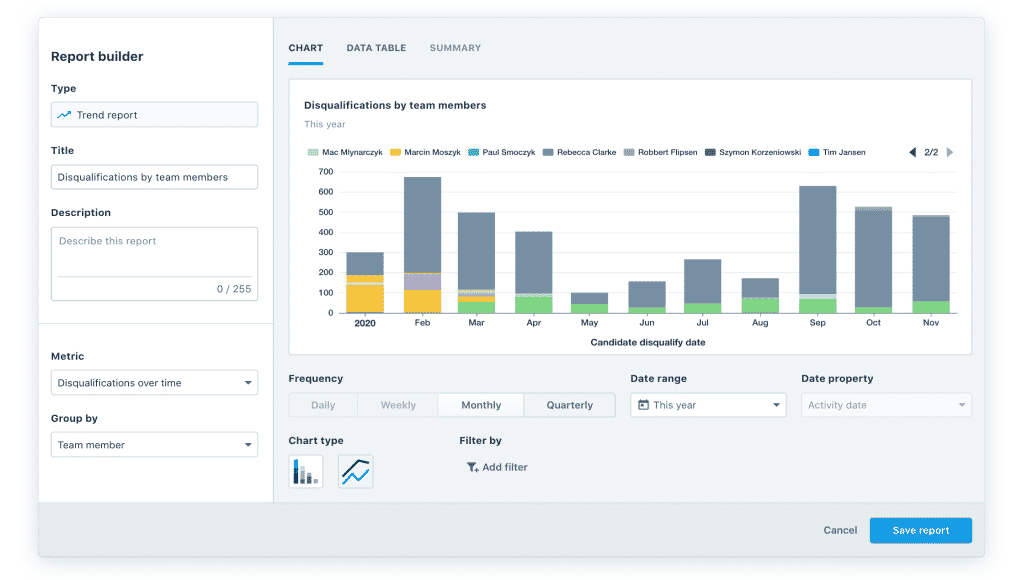
These results will help you to better understand the bigger picture, so you and your team can optimize your hiring process.
Breakdown reports
This report allows you to view essential metrics grouped by different categories, such as job and department. You can use this report to see how the candidates in your pipeline are distributed across stage categories (phone interview, evaluation, etc.). You can also, for example, view the total number of applications per job.
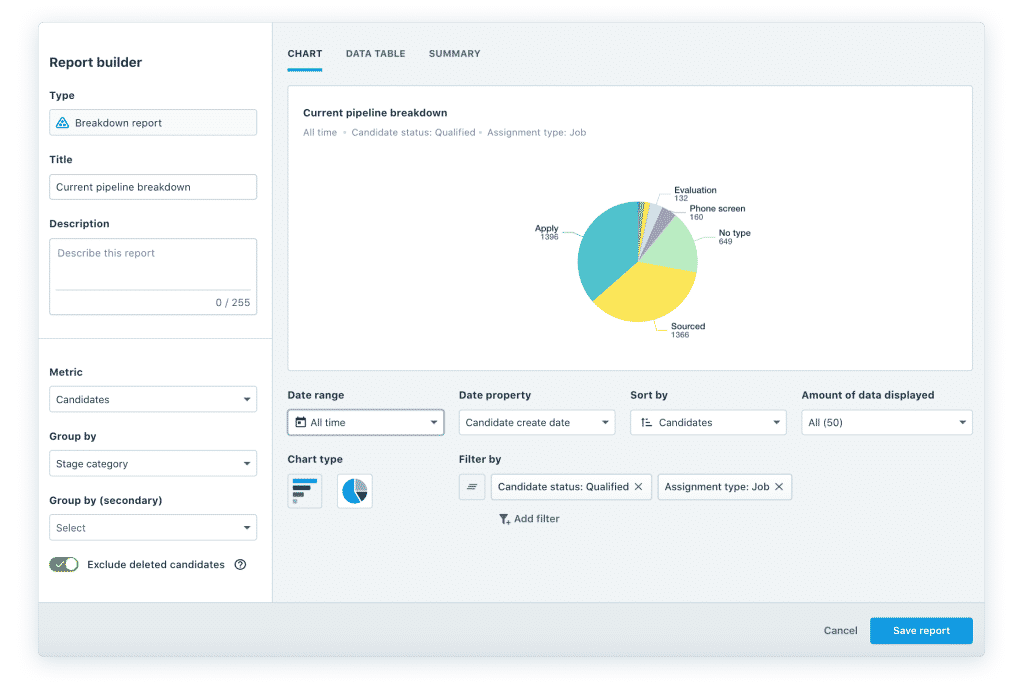
Good to know: You can choose to include or exclude deleted candidates or hires from the results.
Single metric reports
Use this report to view single values that are key to your business goals. Examples include the average time candidates in all jobs spend in any stage category and how long it takes to hire a candidate across all jobs.
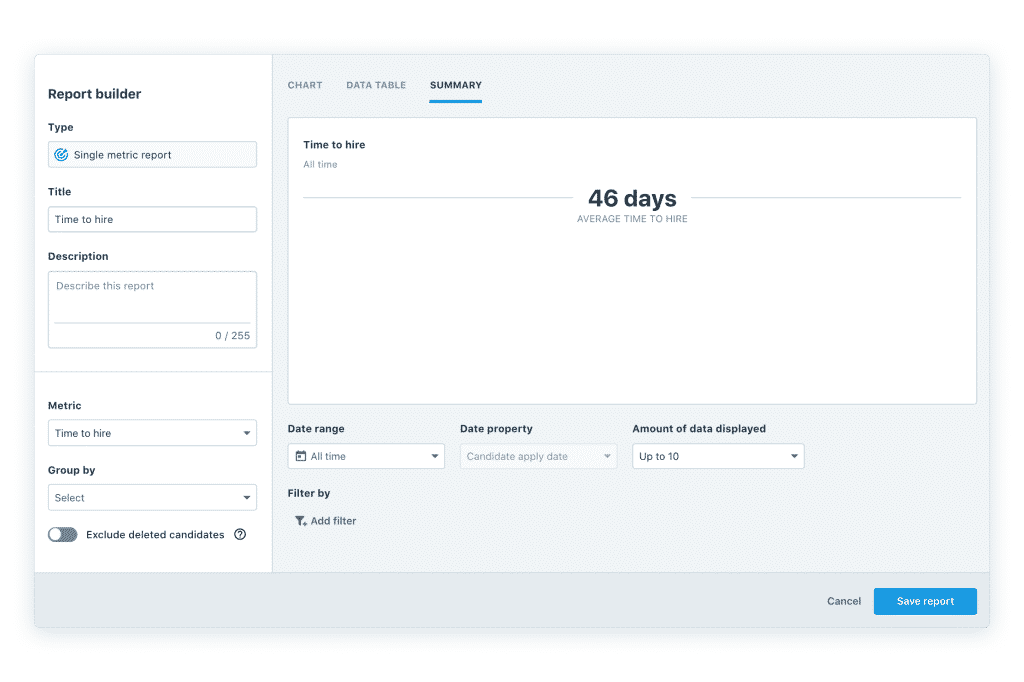
You can edit, duplicate, or delete the reports you add to a dashboard.
Customize or build your own
You can now customize a report from the library or start from a blank canvas. Give your report a title and description, click on a metric, choose a date range, and group your data the way you want.
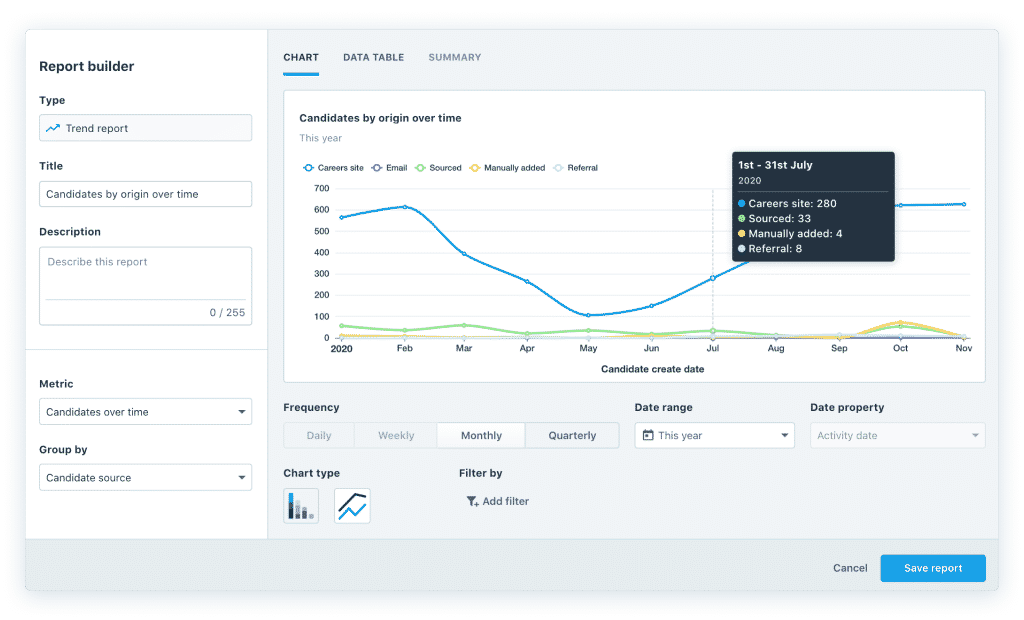
Select a display preference such as a bar or pie chart, data table, or numerical summary. If you hover your mouse over a chart, it will reveal the percentages.
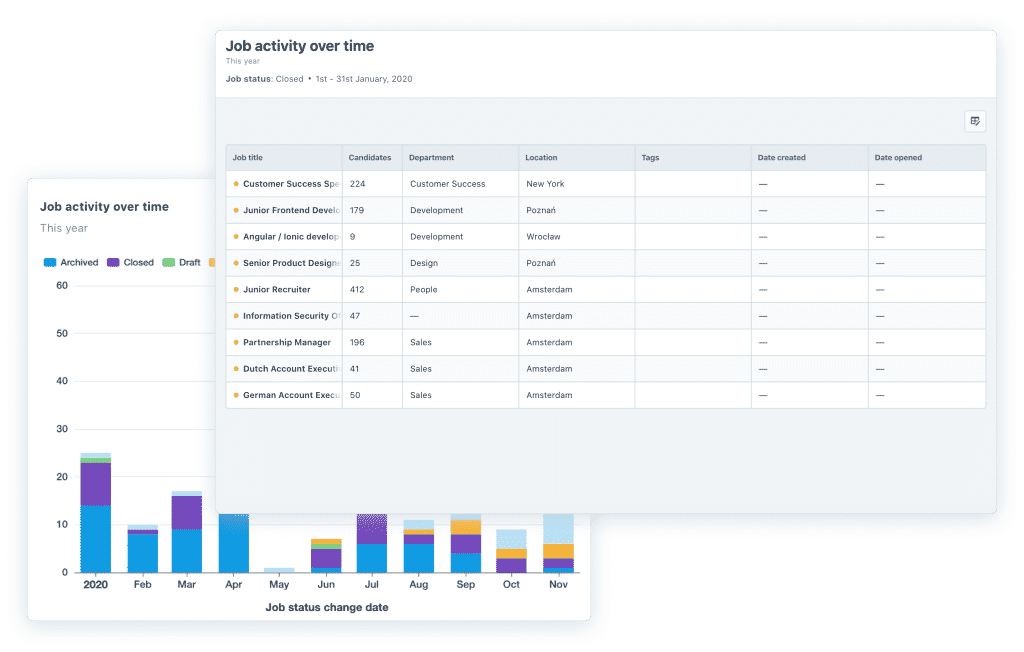
Click on a chart section to reveal more details and dive deeper into your data.
View it your way
Customize your recruitment dashboard to draw attention to your most important reports. If you want to group certain reports or have your most critical reports at the top of your dashboard, simply drag, drop and resize the tiles.
Filter on date range, job, department, role, team member, and talent pool for a more detailed overview of your operations.
Ready to try it out for yourself? Sign up for a free trial. For more inspiration, find out how we use recruitment analytics at Recruitee to make smarter decisions and keep us focused on our goals.
If you need more customization, our integration with Amazon Redshift allows you to sync Recruitee data with your company’s Business Intelligence tool, such as Tableau, Chartio, or Looker.


